Did you know that only 6% of user-profiles on GitHub are female? What the heck!?
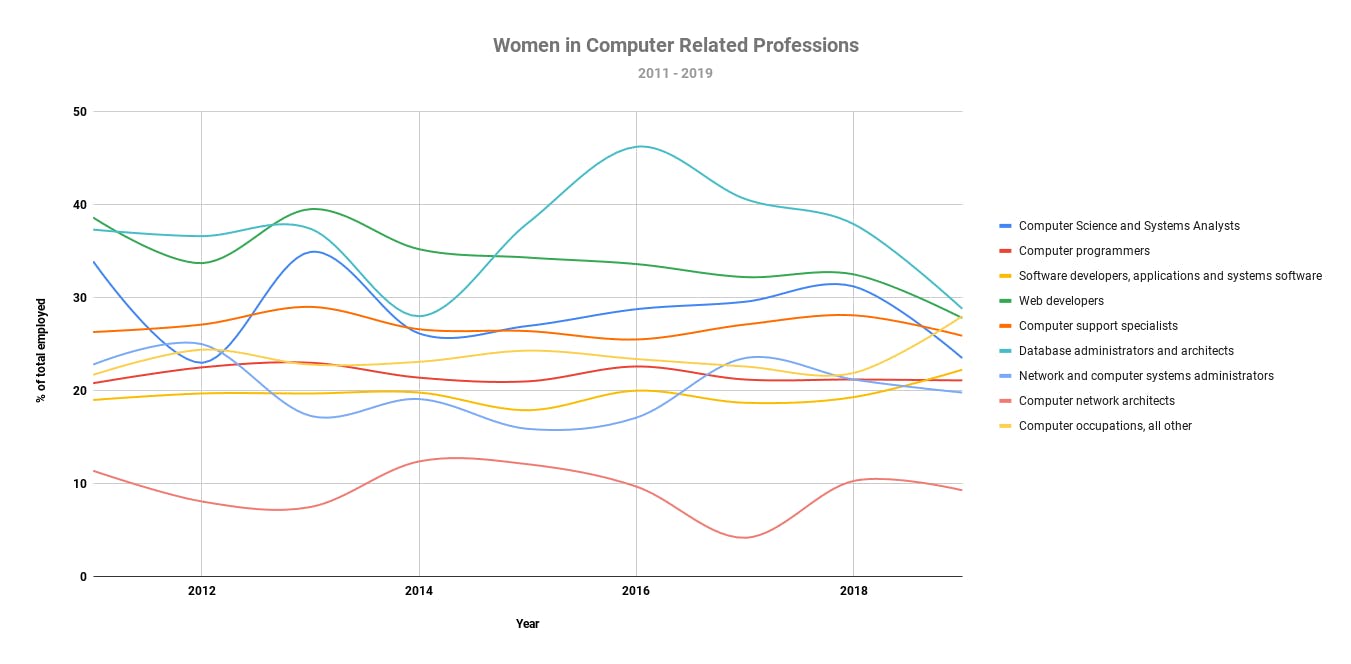
Despite women having made considerable contributions to technology throughout history, the number of women joining the field has remained low. Every year, the US Bureau of Labor Statistics publishes statistical tables that display the data compiled from their monthly Current Population Survey's* in various formats. I found one that broke down employed citizens by detailed occupation and gender for 2019 and became curious about how those numbers have changed over the years in technology. I found the tables for 2011 - 2018, extracted the data, and created a graph. (Note: the categories surveyed have changed slightly over time, some have been combined in my graph for better visibility.)
 Source: US Bureau of Labor Statistics
Even though I am aware that the percentage of women entering STEM fields remains low, I was surprised to see that the numbers in computer-related fields have remained nearly the same since 2011. There have been many camps, school initiatives, and books geared towards girls in STEM over the past 10 years; I genuinely thought these numbers would have improved, at least a little!
I hope you will join me in encouraging women interested in technology to pursue technical careers and shape the tools we all use every day. We need their voices! Here are some links to inspire the women in your life:
*The Current Population Survey (CPS) is a monthly survey of households conducted by the Bureau of Census for the Bureau of Labor Statistics. It provides a comprehensive body of data on the labor force, employment, unemployment, persons not in the labor force, hours of work, earnings, and other demographic and labor force characteristics.
